
Market declines can feel unsettling while they’re happening, but they are a regular part of investing. History offers useful perspective on how past declines, and subsequent market rebounds, have played out.
A Look at Recent Volatility
By November 19, 2026, the S&P 500 had fallen about 8% from its record high on October 6 and the Nasdaq Composite about 13.5%, putting tech-heavy stocks in correction territory while the broad market remained in a pullback. The biggest drop came on November 5 (the week of the midterm elections), when the S&P 500 fell 4.4% and the Nasdaq 100 fell 6.4%, the worst day since April 2025. Even so, the markets were in positive territory for the full year, with the S&P 500 up 5.9% and the Nasdaq up 3.3%.
No single event caused the decline. Investors have been reevaluating and repricing the AI trade at the same moment the Federal Reserve turned toward raising rates. Four developments have driven most of the selling:
- Doubts about AI spending. Investors are questioning whether the sums being committed to data centers and chips will earn an adequate return over time. About a dozen large AI stocks lost roughly $1.4 trillion in value on November 5 alone, after Micron paused a planned plant, Qualcomm issued a weak outlook and Oracle and Marvell announced additional funding plans.
- Policy and politics. After the November 3 midterms, some incoming state leaders signaled support for pausing new data-center construction. On November 16 the Commerce Department added licensing requirements for advanced AI chip exports to several countries. AI spending has been a significant contributor to GDP growth. A slowdown in that spending could weigh on the U.S. economy.
- Rising rates. The Federal Reserve raised rates in September, its first hike since 2023, and October inflation came in hotter than expected. Futures now price another quarter-point rate hike in December 2026, followed by one or two more in 2027. Treasury yields have risen across the curve as a result of higher inflation. Higher yields lower the present value of future earnings, which tends to hit richly valued growth stocks hardest.
- Company-specific shocks. Nvidia CEO Jensen Huang resigned on November 12, unsettling the market’s largest AI bellwether. Anthropic’s record IPO on November 19 did not restore confidence; its shares have fallen to near their IPO price.
We believe underlying fundamentals remain solid and earnings continue to come in above expectations. Of the 462 S&P 500 companies that had reported third-quarter results through November 18, Bloomberg reports over 60% beat analyst estimates.
Pullbacks are a Normal Part of Investing
The current 8% decline in the S&P 500 is smaller than a typical year’s worst drop. Since 1990, the Index has fallen an average of 14% from a peak at some point each year, yet it finished flat or higher in 27 of 36 years.
S&P 500 Annual Returns with Largest Intra-Year Drawdowns
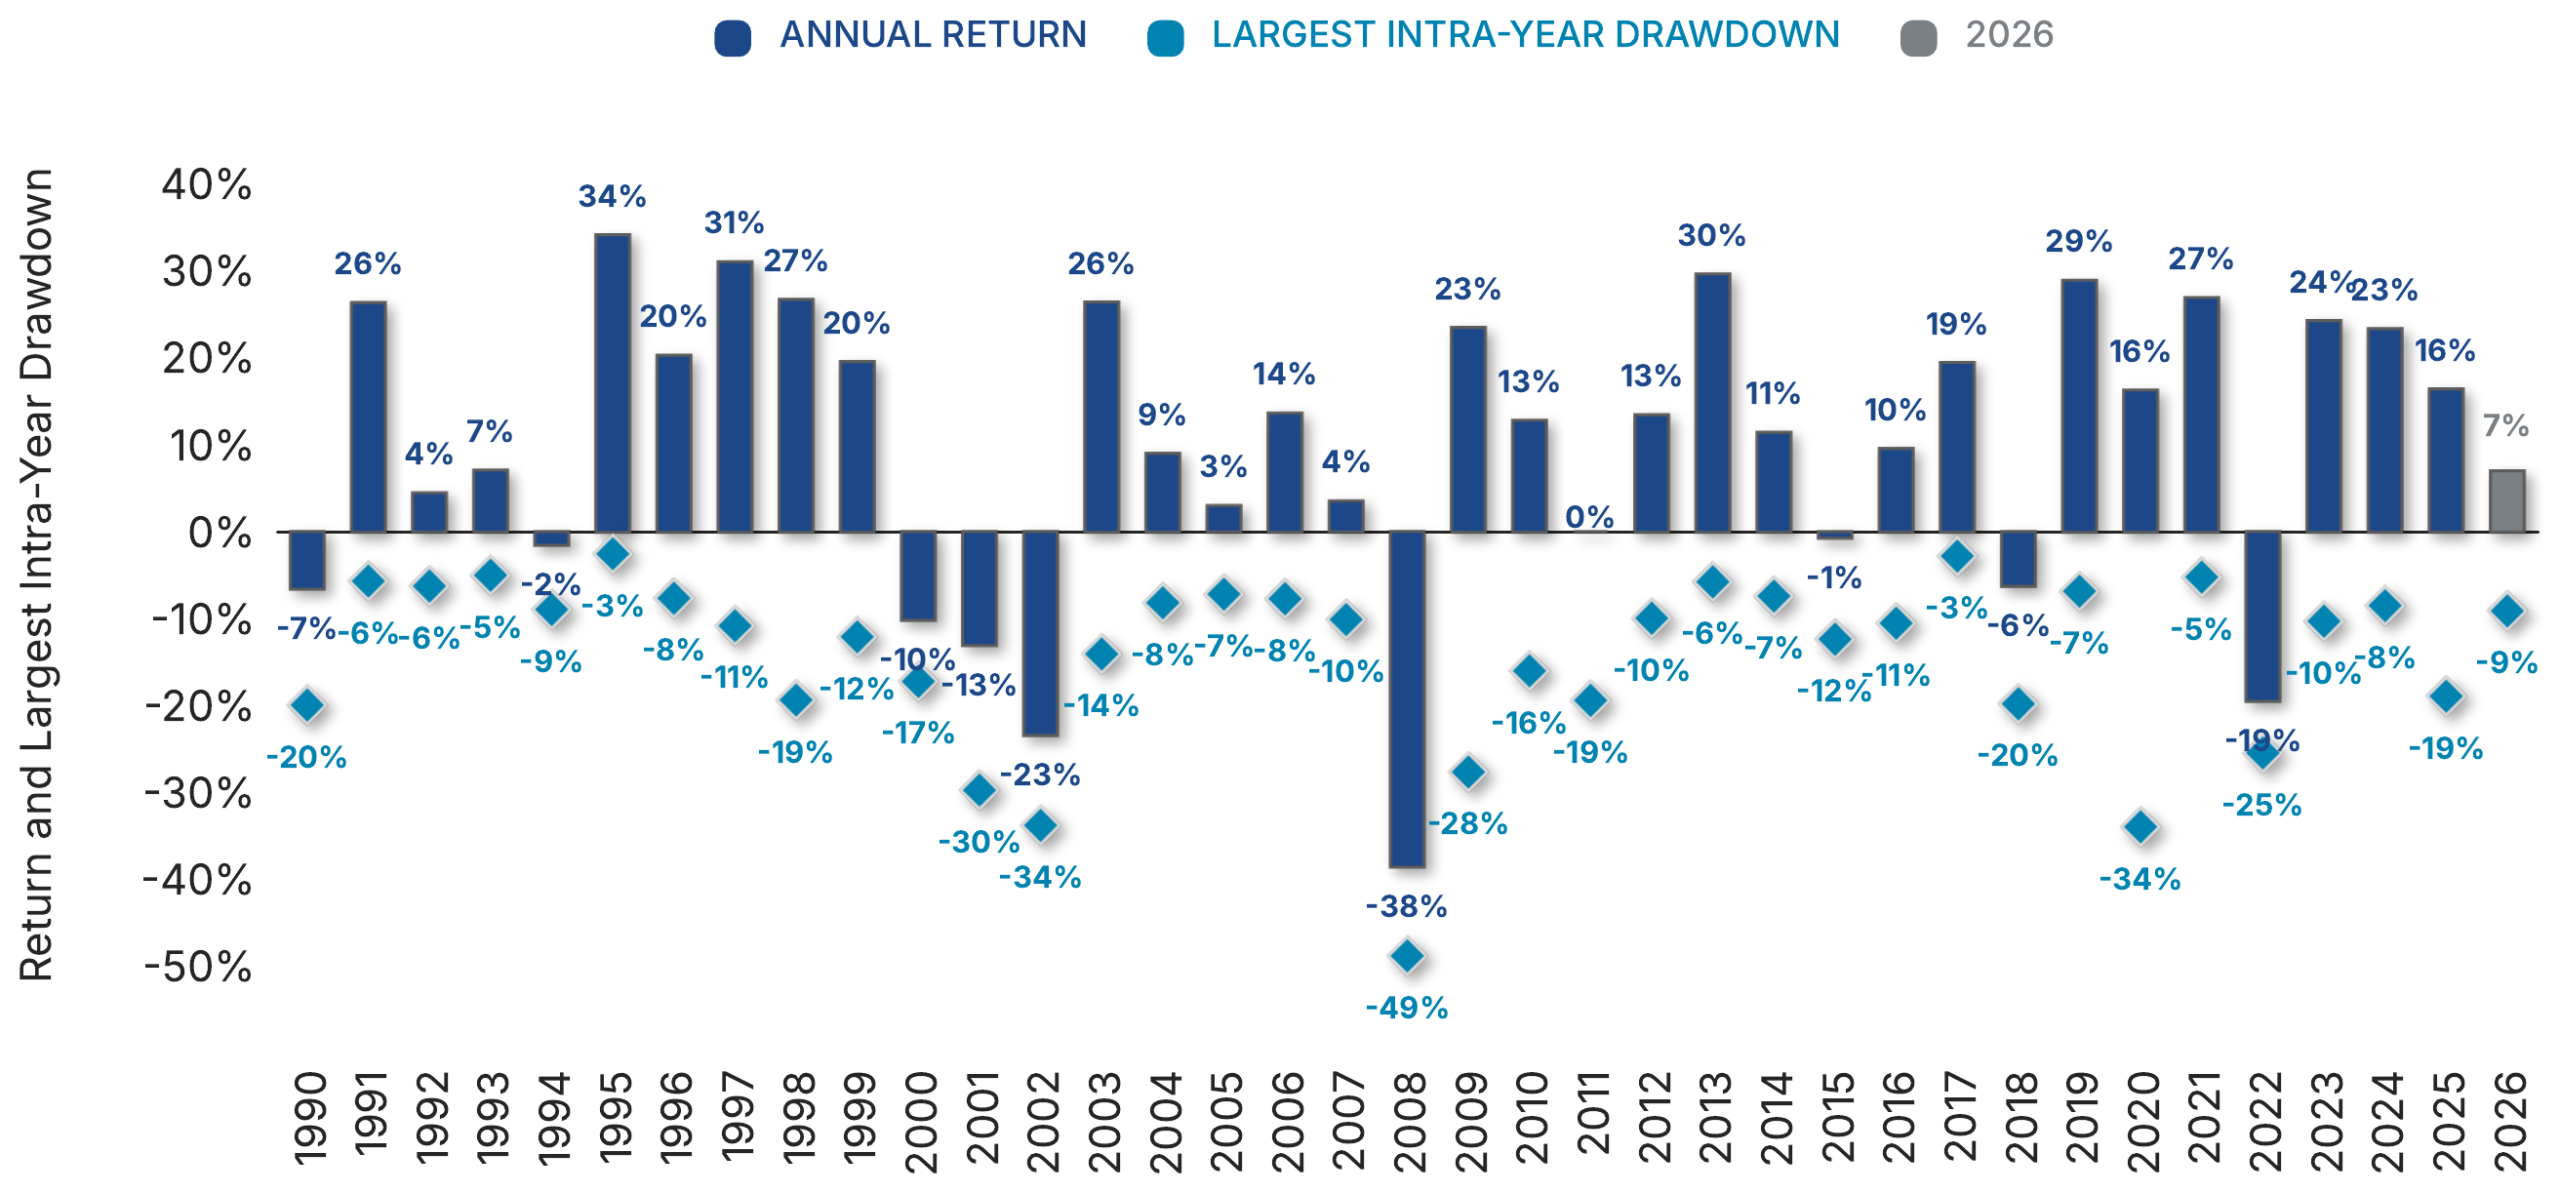
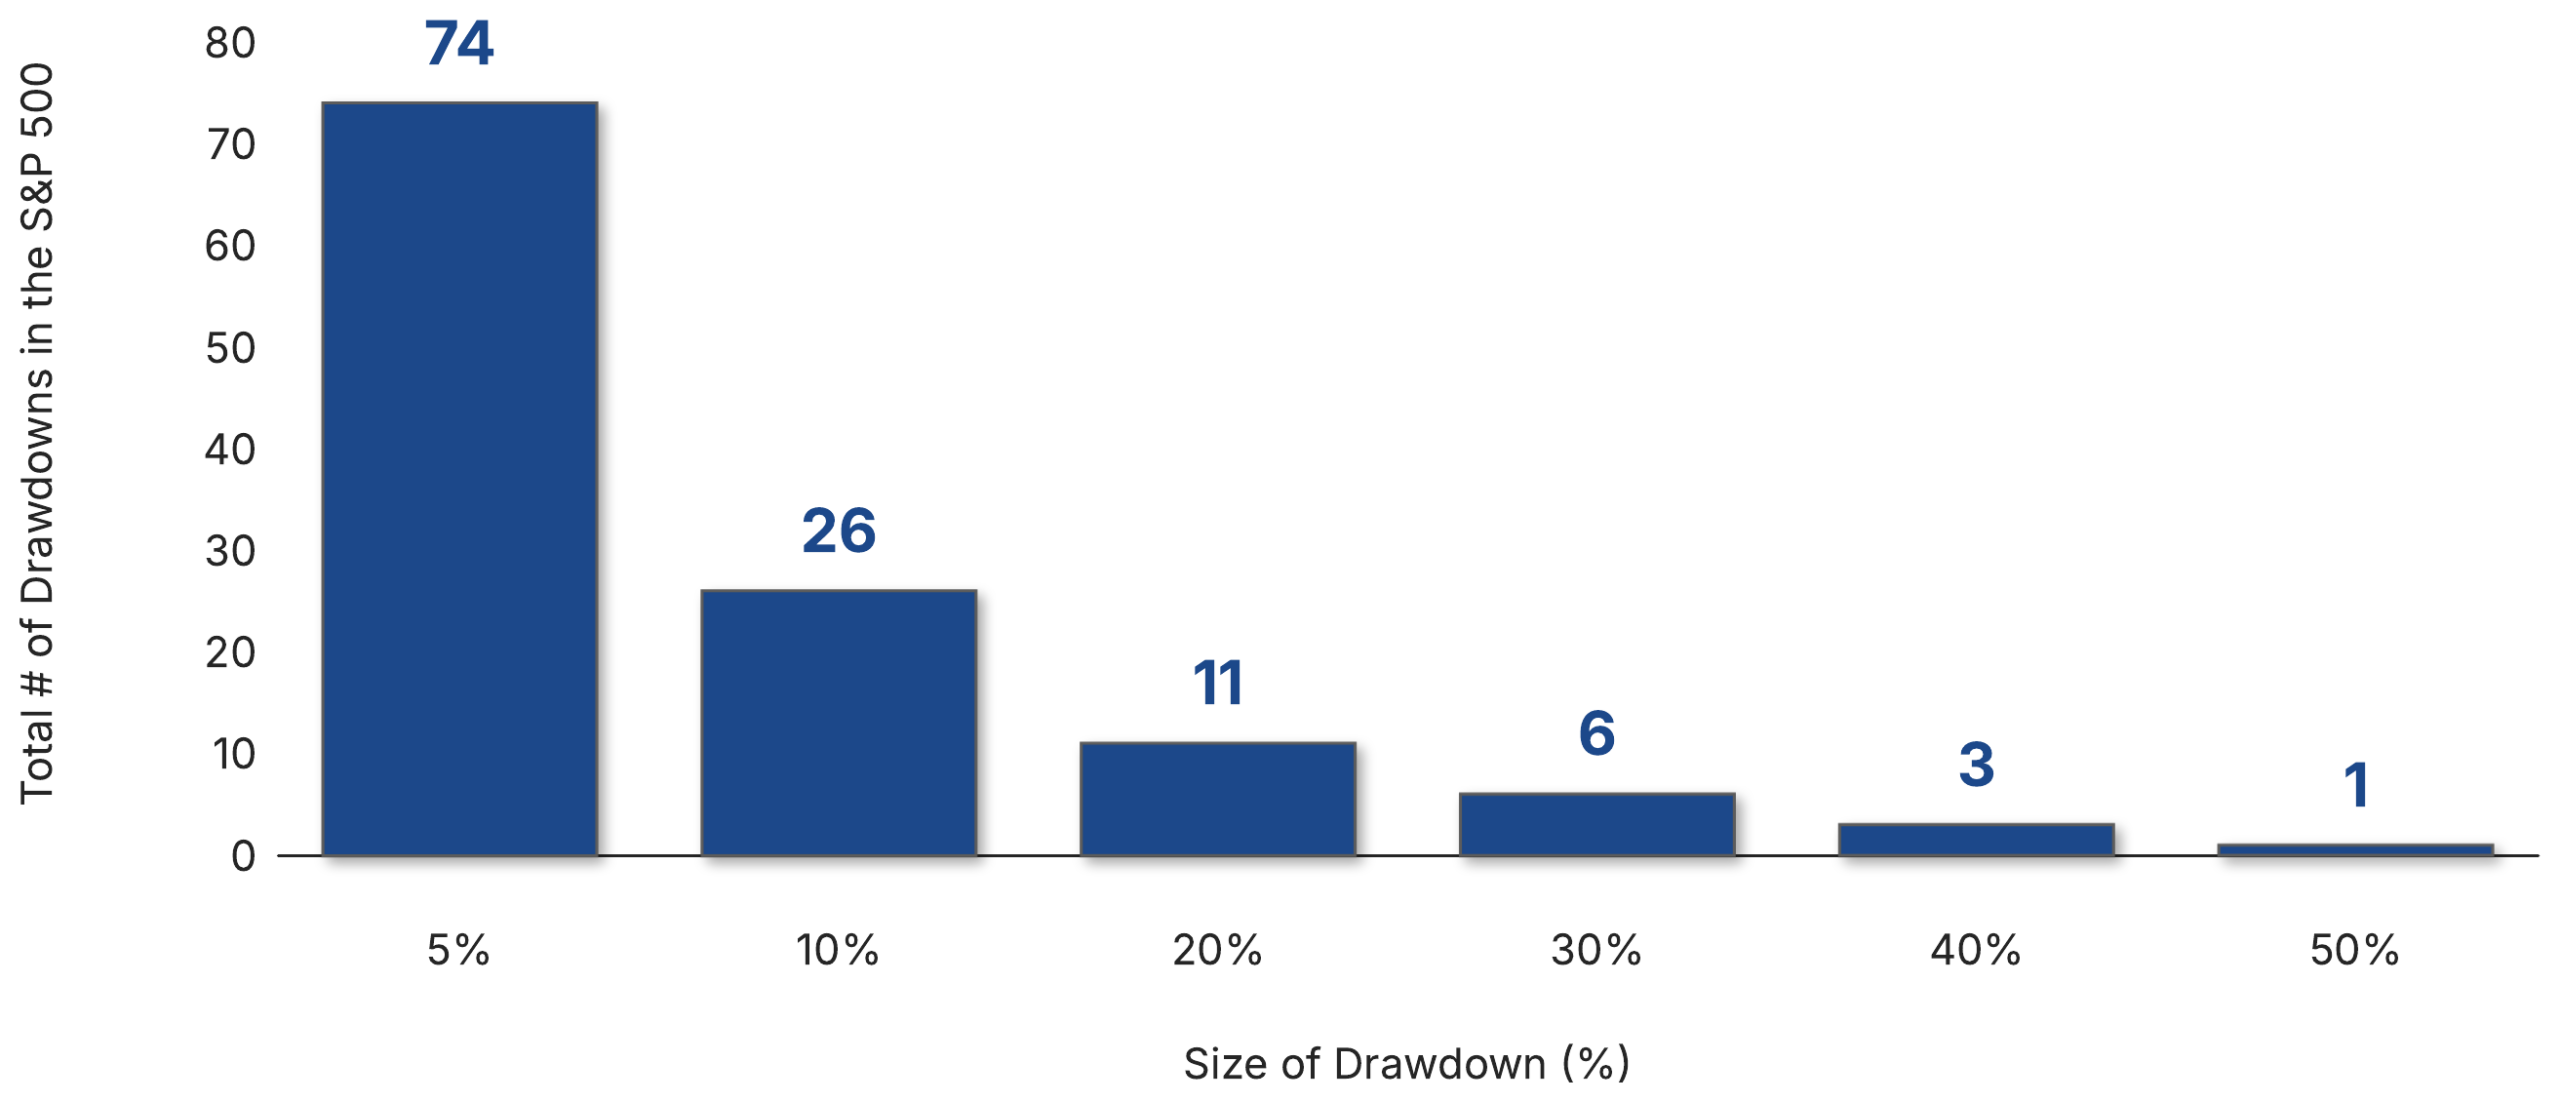
In 35 of those 36 years the S&P 500 fell at least 5% at some point, and in 21 years it fell 10% or more. Since 1950, declines of 5% or more have arrived about 1.6 times a year on average.
S&P 500 Drawdowns Since 1950 by Size
Recoveries Have Followed Every Decline
Every S&P 500 decline of 15% or more since 1929 (30 in all) has been followed by a recovery, and the average return in the first six months after the market bottomed was about 30%. The timing of recoveries varies, as shown, and no one has a crystal ball to know when the market will hit a trough.
S&P 500 Declines & Recoveries
| Peak date | Trough date | Decline | 3 months | 6 months | 12 months | 3 years | 5 years |
|---|---|---|---|---|---|---|---|
| Feb 19, 2025 | Apr 8, 2025 | -18.9% | 24.9% | 35.6% | 37.8% | ||
| Jan 3, 2022 | Oct 12, 2022 | -25.4% | 11.3% | 14.4% | 21.6% | 86.0% | |
| Feb 19, 2020 | Mar 23, 2020 | -33.9% | 40.0% | 44.7% | 74.7% | 76.3% | 157.5% |
| Sep 20, 2018 | Dec 24, 2018 | -19.8% | 19.0% | 25.3% | 37.1% | 103.7% | 103.1% |
| Apr 29, 2011 | Oct 3, 2011 | -19.4% | 16.2% | 28.6% | 32.0% | 79.0% | 96.6% |
| Average | -31.8% | 23.8% | 30.7% | 39.2% | 57.9% | 85.6% | |
| Median | -27.6% | 17.7% | 25.6% | 33.5% | 55.3% | 79.8% | |
| Periods positive | 30 of 30 | 30 of 30 | 29 of 30 | 27 of 29 | 27 of 28 |
Source: Ancora calculations using S&P 500 daily closing prices and Yardeni Research’s history of S&P 500 corrections and bear markets. Showing five most recent S&P 500 declines of 15%+ (averages, medians and counts including all periods since 1929), as of November 19, 2026. Price returns measured from trough and exclude dividends.
How We Approach Pullbacks
For long-term investors, a pullback is a good reason to review your plan, but it’s not a time to abandon it. Historically, diversified portfolios have tended to experience smaller swings than concentrated ones.
- Review Concentration. The recent decline has been led by AI, semiconductors and mega-cap tech, so portfolios heavy in those names have felt it most. Diversified portfolios with value, dividend, international and fixed-income exposure are likely to have seen less movement.
- Revisit the role of bonds. With yields well above where they sat for most of the 2010s, high-quality bonds may offer meaningful income and help cushion equity swings. We assess whether each client’s fixed-income allocation still fits their income needs and risk tolerance.
- Rebalance toward targets. Market moves can push allocations away from their targets. Rebalancing is one way we bring portfolio risk back in line with each client’s plan.
- Losses can be put to work. In taxable accounts, realized losses may be used to help offset gains and up to $3,000 of ordinary income per year. We coordinate these decisions with clients and their tax advisors.
- Keep new contributions working. For clients still adding to their portfolios, investing at regular intervals means those dollars buy in at a range of prices.
- Remain disciplined. Selling after a decline locks in losses and risks missing the rebound, which often comes without warning.
Every pullback has its own causes, but declines of this size are an ordinary part of investing. What has not changed is our approach. We remain focused on diversified portfolios built around each client’s goals and time horizon. Please reach out to your Ancora team with any questions about your portfolio.
Past performance does not guarantee future results. Index performance is provided for illustrative purposes only, does not reflect the deduction of fees or expenses, and is not representative of any specific investment or portfolio. It is not possible to invest directly in an index. Diversification does not ensure a profit or protect against loss. This material is provided for informational purposes only and should not be construed as individualized investment, tax or legal advice.